What Is Instagram Insights and Why Does It Matter in 2026?
Instagram Insights is the free, built-in analytics dashboard that shows exactly how your content performs — from post reach and engagement rate to audience demographics and follower activity. If you want to know how to use Instagram Insights, the process takes three steps: switch to a Professional account (Business or Creator), tap the menu icon on your profile, and select Insights. From there, you get real-time data on every post, Story, and Reel you publish.
With over 2 billion monthly active users on the platform according to Meta's Q4 2025 earnings report, the competition for attention is fierce. Insights removes the guesswork by revealing what resonates with your specific audience — which content formats drive saves and shares, when your followers are most active, and whether your reach is growing or declining. If you are new to the platform, our beginner's guide to Instagram covers the fundamentals before diving into analytics.
In our experience helping creators and businesses since 2013, Insights is the single most underused growth tool on Instagram. Most accounts check likes and move on. The ones that grow consistently are the ones reading their data weekly and adjusting their content strategy based on what the numbers actually say.
Key Takeaway: Instagram Insights is free for all Professional accounts. It tracks reach, impressions, engagement rate, saves, shares, profile visits, and audience demographics — everything you need to make data-driven content decisions in 2026.
Why Are My Instagram Insights Not Showing?
The most common reason Instagram Insights doesn't appear is that your account is still set to personal. Insights require a professional account — either Business or Creator — and the switch is free and instant from your profile settings.
If you already have a professional account and Insights still won't load, work through these steps:
- Check your follower count. According to Instagram's Help Center, some demographic breakdowns require a minimum of 100 followers before data populates.
- Update the app. Outdated versions sometimes fail to display newer Insights panels. Open your device's app store and install the latest Instagram update.
- Wait 24–48 hours after switching. Instagram needs time to collect data on a newly converted professional account. Metrics won't appear until there is enough activity to report.
- Clear cache and restart. On Android, go to Settings → Apps → Instagram → Clear Cache. On iOS, delete and reinstall the app.
- Check for regional restrictions. A small number of Insights features roll out gradually and may not be available in every country at launch.
Watch out for fake "insights checkers." Third-party websites that promise free Instagram analytics by asking for your password are almost always credential-harvesting scams. Legitimate tools use the official Meta API and never request your login directly. Stick to apps listed in Meta's official partner directory or well-known platforms with documented API access.
If none of these fixes work, try unlinking and relinking your Facebook Page from your Instagram business account. This refreshes the data connection between Meta's systems and resolves most persistent loading issues. Once the connection is restored, you can start learning how to use Instagram Insights from the overview dashboard.
Your Next Step — Put Instagram Insights to Work
Knowing how to use Instagram Insights is only valuable if you act on what the data reveals. Start with one habit this week: open your Insights tab every Monday morning, identify your top-performing post from the past seven days, and ask yourself why it worked. Was it the format, the posting time, or the topic? Then replicate that pattern in your next piece of content.
Over time, this weekly review compounds into a data-driven growth strategy that removes guesswork from your content calendar. Creators who track performance consistently — adjusting content mix, posting times, and audience targeting based on real numbers — build engaged communities faster than those who post on instinct alone.
Ready to accelerate your Instagram growth? Pair your Insights data with real engagement from FiveBBC's Instagram Growth Services — trusted by creators and small businesses worldwide.
How Do You Turn On Instagram Insights?
You need a Professional account to access Instagram Insights — personal and private profiles do not have full analytics. Switching is free, takes under a minute, and does not affect your existing followers or content.
How to Switch to a Professional Instagram Account
- Open Instagram and navigate your profile
- Tap the menu icon (three lines) in the top-right corner
- Go to Settings and Privacy → Account type and tools
- Select Switch to Professional Account
- Choose either Business or Creator (you can change later)
- Complete the category selection and contact details
- Tap Done — Insights will appear on your profile immediately
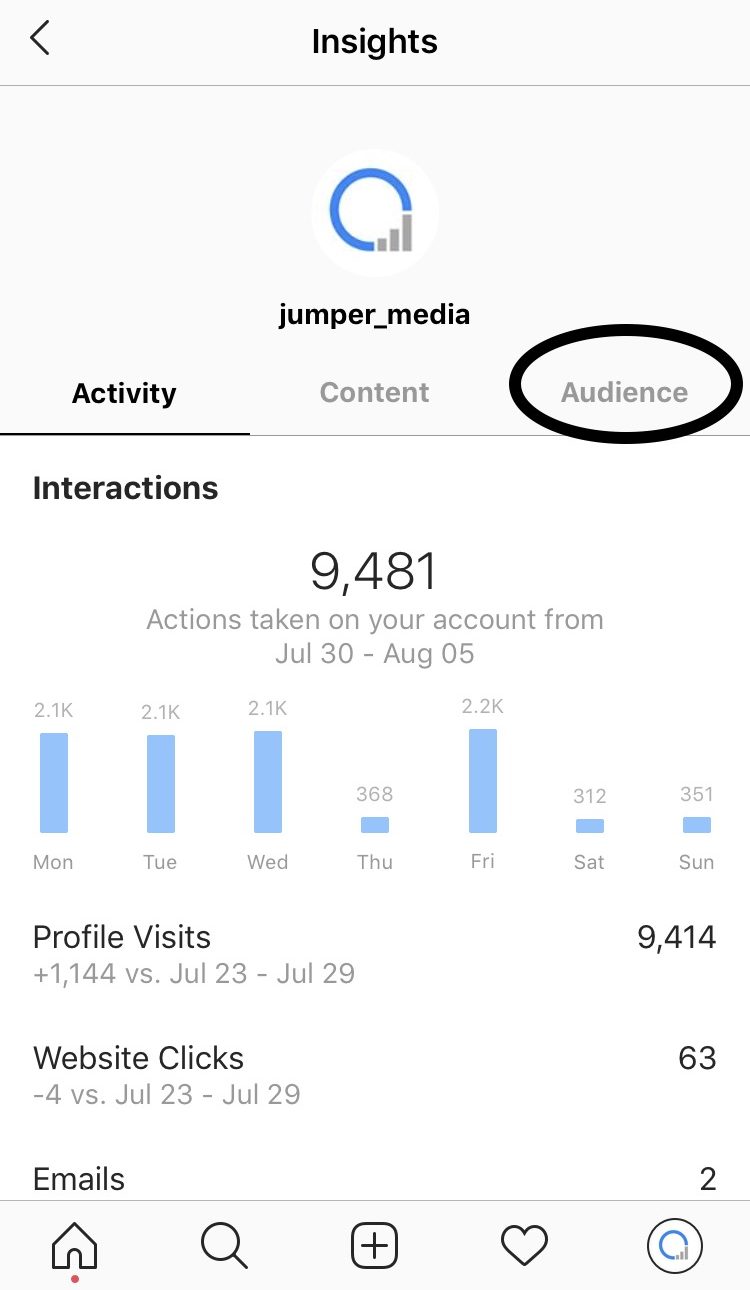
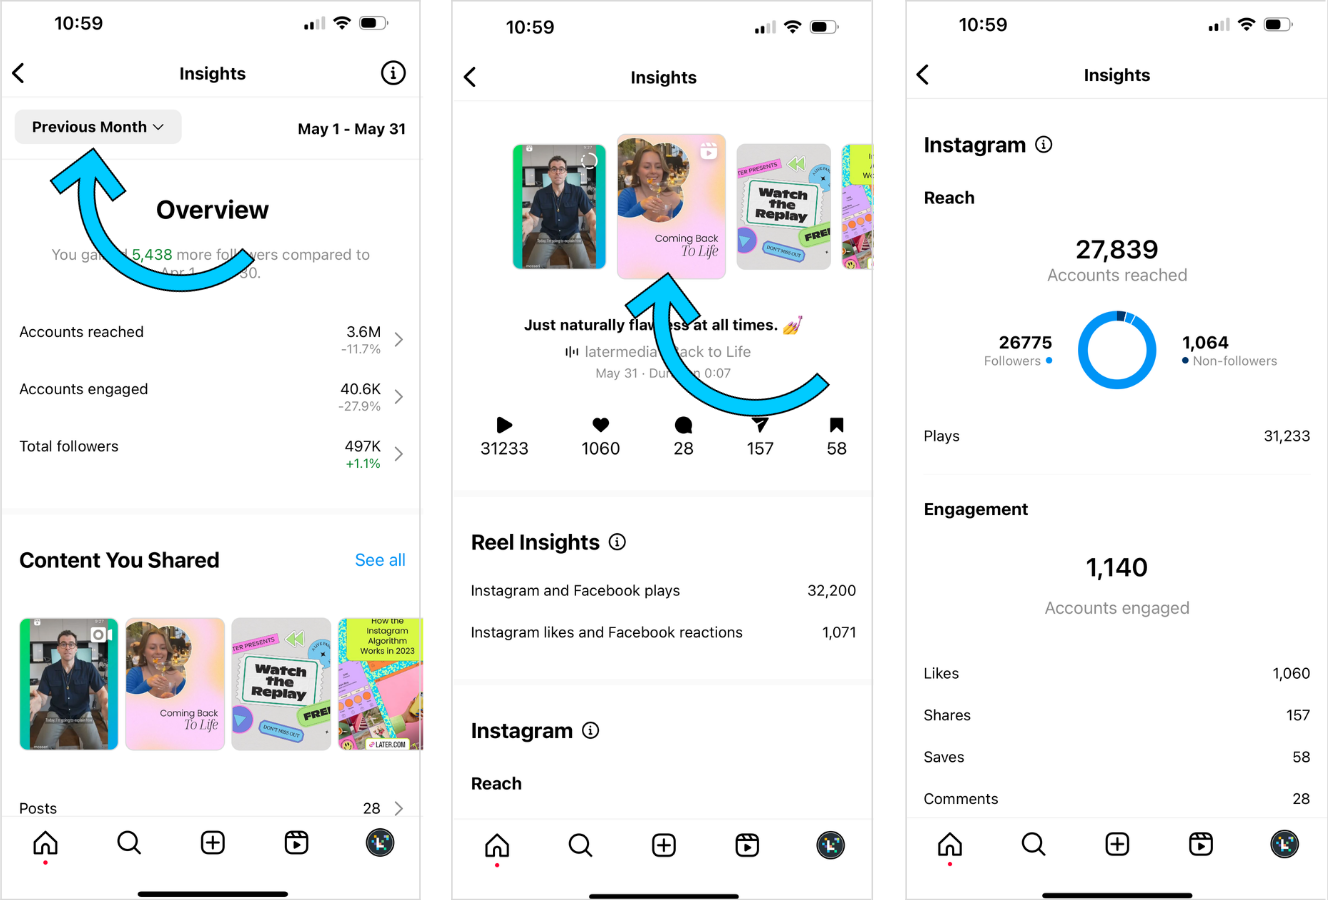
Once the switch is complete, tap the menu again and select Insights to open your analytics dashboard. You will see three tabs: Overview, Content You Shared, and Audience.
Access Insights on Desktop via Meta Business Suite
For deeper analysis, open Meta Business Suite on desktop. Navigate to Insights in the left sidebar. The desktop version provides extended filtering by date range, content type, and engagement source. Business accounts using Meta Business Suite see up to 2x more demographic data compared to the mobile-only experience, according to Meta's Business Help Center.
Pro Tip: Desktop Insights through Meta Business Suite supports CSV exports — ideal for monthly reporting and team collaboration. Mobile Insights are better for quick daily checks.
Business vs Creator vs Personal: What Can You See?
| Feature | Business Account | Creator Account | Personal Account |
|---|---|---|---|
| Post & Reel Insights | Full metrics | Full metrics | Likes & comments only |
| Stories Insights | Full (exits, taps, replies) | Full (exits, taps, replies) | View count only |
| Audience Demographics | Age, gender, location, active hours | Age, gender, location, active hours | Not available |
| Content Performance History | 90 days (desktop) | 90 days (desktop) | Not available |
| Contact Buttons & CTAs | Yes | Limited | No |
| Meta Business Suite Access | Full | Full | No |
If you want to know how to see post insights on Instagram personal account or how to see insights on Instagram private account — the short answer is that you cannot access full analytics without switching. Personal and private accounts only show basic like and comment counts. The switch to Professional is free and reversible.
What Do Instagram Insights Metrics Mean?
Every number inside Instagram Insights tells you something specific about how your audience interacts with your content. Understanding these metrics is the difference between guessing and growing strategically. Here is what each core metric means and why it matters for your account insights.
| Metric | Definition | Why It Matters |
|---|---|---|
| Reach | Total unique accounts that saw your content | Measures how widely your post spreads — the primary indicator of content visibility |
| Impressions | Total number of times your content was displayed (includes repeat views) | Shows exposure frequency — high impressions with low reach means the same people see your content multiple times |
| Engagement Rate | Percentage of users who interacted (likes, comments, saves, shares) divided by reach | Reveals content relevance — the single best predictor of algorithmic promotion |
| Profile Visits | Users who tapped your profile after seeing a post or Story | Indicates curiosity and intent — high visits mean your content sparks interest in your brand |
| Saves | Times users bookmarked your post for later | Signals educational or emotional value — saved posts consistently outperform in long-term reach |
| Shares | How many times your post was sent via DM or shared to Stories | Measures virality — the Instagram algorithm in 2026 heavily weights shares and sends |
| Follows | New followers gained from a specific post, Story, or Reel | Identifies which content type converts casual viewers into committed audience members |
| Watch Time | Average duration viewers spent watching your video content | Critical for Reels and video posts — longer watch time signals quality to the algorithm |
| Forward Taps | Viewers who tapped to skip to the next Story frame | A high forward rate suggests your Story frame was not engaging enough to hold attention |
| Exit Rate | Percentage of viewers who left your Stories entirely | Worse than forward taps — exits mean viewers disengaged completely, not just skipped ahead |
| Story Replies | Direct messages triggered by a Story frame | One of the strongest engagement signals — replies indicate genuine two-way connection |
| Link Clicks | Taps on link stickers or swipe-up actions in Stories | Measures how effectively your content drives traffic to external destinations |
| Replay Rate | How often viewers rewatched your Reel or video | High replays signal compelling content that the algorithm is more likely to surface on Explore |
The average Instagram engagement rate across all industries sits at 0.54% according to RivalIQ's 2025 Social Media Benchmark Report. If your rate is above 1%, your content significantly outperforms most accounts. If it falls below 0.3%, focus on improving hooks, storytelling, and calls to action within your posts.
Understanding "Forward" in Instagram Insights: The instagram insights forward meaning refers specifically to Story taps. When a viewer taps the right side of their screen to skip to the next frame, that counts as a forward tap. It is different from an exit (leaving Stories entirely). A few forward taps are normal — viewers scan quickly. But if more than 70% of viewers tap forward on a specific frame, that content needs a stronger visual hook or shorter text.
The instagram insights views meaning depends on context. For posts and Reels, "views" typically refers to impressions or plays (total display count). For Stories, views reflect unique accounts that opened the frame. Always check whether Instagram is showing you reach (unique) or impressions (total) — the distinction shapes how you interpret content performance.
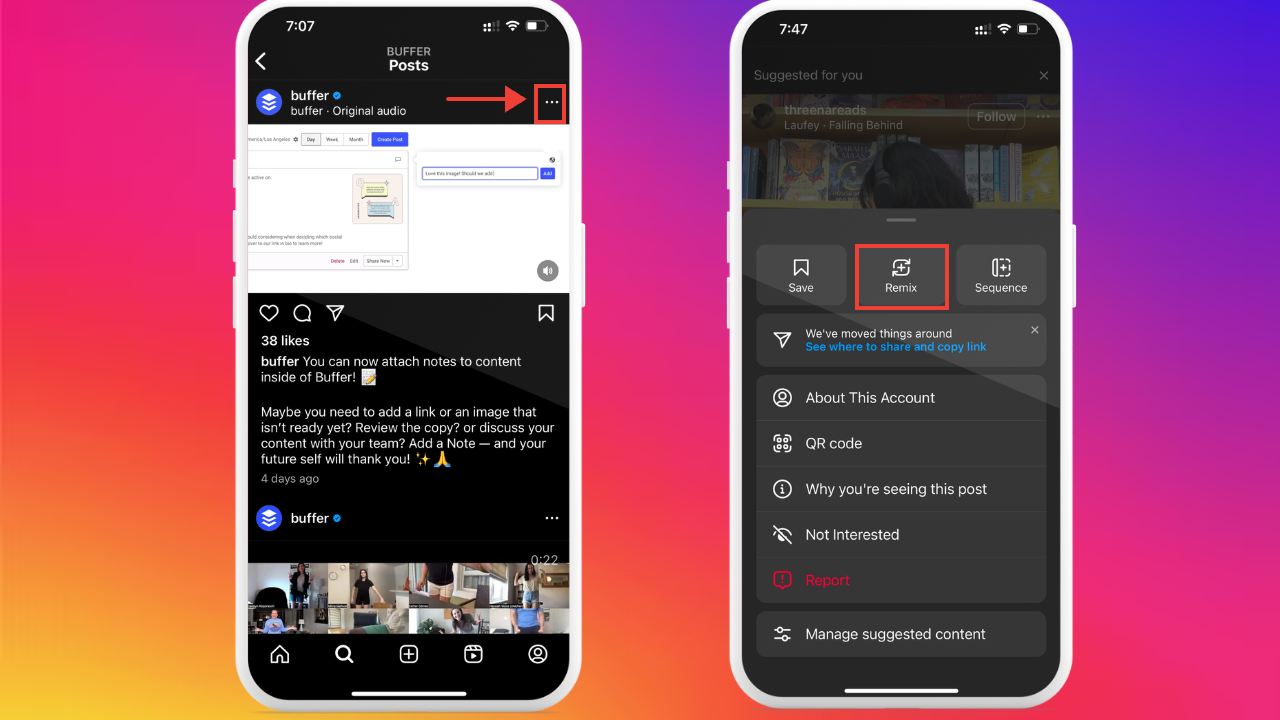
How Do You Read Instagram Stories Insights?
Learning how to use Instagram Insights for Stories reveals how viewers move through your content frame by frame — which slides hold attention and where people drop off. Knowing how to view Instagram story insights helps you build Stories that keep viewers engaged instead of tapping away.
How to Access Stories Insights
- Open your Instagram profile and tap Insights from the menu
- Scroll to Content You Shared and select Stories
- Filter by time period (last 7, 14, or 30 days) and sort by any metric
- Tap an individual Story to see frame-by-frame analytics
You can also view insights for an active Story by swiping up while viewing it. This shows real-time reach, impressions, and interaction data for each frame.
Key Instagram Stories Insights Metrics
| Metric | What It Measures | What to Watch For |
|---|---|---|
| Forward Taps | Viewers who skipped to the next frame | High rate = content did not hold attention — use stronger visuals or shorter text |
| Back Taps | Viewers who rewound to see the previous frame again | A positive signal — your content was interesting enough to revisit |
| Exits | Viewers who left your Stories entirely | The strongest negative signal — more concerning than forward taps |
| Replies | Direct messages triggered by a frame | Highest-value engagement — indicates real conversation and connection |
| Link Clicks | Taps on link stickers | Measures how well your Story drives traffic to external pages |
| Sticker Taps | Interactions with polls, quizzes, sliders, and question stickers | Tracks active participation — interactive frames consistently outperform passive ones |
Stories with interactive stickers see up to 83% more engagement than passive Stories, according to Instagram's Creators account. Polls, quizzes, and emoji sliders give viewers a reason to interact rather than just watch. If your exit rate is high, try placing an interactive sticker within the first two frames to hook attention early.
New in 2026 — Story Sticker Insights: Instagram now breaks down performance for each individual sticker within a Story frame. You can see exactly how many people voted in a poll, answered a quiz, or moved a slider — plus the specific response distribution. This makes it possible to test which sticker types drive the most replies and create Instagram Story collages that combine interactive elements with visual storytelling.
The most actionable pattern to watch is the relationship between forward taps and exits across consecutive frames. If forward taps spike on frame 3 but exits spike on frame 5, your middle content holds some interest but your closing frames lose people. Restructure so the strongest hook or call-to-action appears earlier in the sequence.
How Do You Use Instagram Insights for Reels?
Knowing how to use Instagram Insights for Reels shows you exactly which short-form videos drive reach, saves, and new followers — and which ones fall flat. Meta reported that Reels generate 22% more interaction than standard image posts (2025 creator data), making them the highest-performing content format on the platform.
To access Reels analytics, open any published Reel and tap View Insights below the caption. You can also navigate your profile, tap the Professional Dashboard, and select Content You Shared filtered by Reels. Both paths show the same data, but the dashboard view lets you compare multiple Reels side by side.
Key Instagram Reels Insights Metrics
Focus on these metrics when evaluating Reel performance:
- Plays and Replays: total views plus how often viewers re-watched — high replay rate signals compelling content
- Average Watch Percentage: the share of your Reel viewers watched before swiping away (aim for 70%+)
- Sends per Reach: how many viewers shared your Reel via DM relative to total reach — this is the top algorithm signal in 2026
- Saves: viewers bookmarking your Reel for later, a strong indicator of lasting value
- Follows from Reel: new followers attributed directly to a specific Reel
Pro Tip: In 2026, Instagram added the ability to swipe between Reels directly within the Insights view, plus a dedicated Repost metric that tracks how many accounts re-shared your Reel to their Stories. Sends per Reach above 1.5% consistently correlates with Explore page placement.
If your Reels pull strong views but low follows, the content entertains without building loyalty. Shift toward educational or opinion-driven formats that give viewers a reason to stay. Creators who create better Instagram videos by combining hook-driven openings with actionable tips tend to see the strongest conversion from views to followers. You can also use how to use Instagram Insights data to test whether carousel Reels or single-clip Reels perform better for your niche — the new slide-level engagement metric breaks down retention per slide.
What Are the New Instagram Insights Features in 2026?
Instagram quietly rolled out several new analytics capabilities in early 2026, and most creators haven't discovered them yet. Understanding how to use Instagram Insights effectively now means mastering an entirely new set of metrics — these additions transform the dashboard into a genuine content strategy tool.
Here are the most significant updates:
- Post-Level Follower Growth: every post, Reel, and Story now shows exactly how many new followers it generated. No more guessing which content drives account growth.
- Carousel Slide-Level Engagement: for carousel posts, Insights now break down likes, saves, and time spent per individual slide. This reveals which slides hold attention and which cause viewers to swipe away.
- Engagement Timing Heatmap: a visual chart showing when your followers interact with your content most actively, broken down by day and hour. This goes beyond the older "active times" bar chart with far more granularity.
- New Follower Demographics: a dedicated breakdown of where your newest followers come from — by country, age range, and discovery source (Explore, Reels, hashtags, or profile visits).
- Repost Metric: tracks how many accounts re-shared your content to their own Stories, giving visibility into organic amplification.
- Sends per Reach: now displayed prominently on every post's Insights page. Instagram's creator team reported that videos with above-average send rates receive significantly more distribution in 2026, making this the single most important algorithm signal.
- Shareable Insights PDF: export a branded analytics report directly from the Edits app — ideal for creators sharing performance data with brand partners.
- Audience Sentiment Tracking: an early-access feature that categorizes comment sentiment (positive, neutral, negative) using Meta's AI models, giving you a quick pulse on how followers respond to each post. According to Inro Social's 2026 Instagram Insights analysis, this feature alone can reduce the time creators spend manually reading comments by up to 80%.
- Cross-Platform Attribution: for accounts connected to Facebook and Threads, Insights now show which platform drove traffic to your Instagram content.
Key Insight: To access these 2026 features, make sure your Instagram app is updated to the latest version (March 2026 or later). Some features, like Audience Sentiment Tracking, are rolling out gradually and may appear under Professional Dashboard → Try New Features.
The most impactful change for data-driven creators is the combination of post-level follower growth and carousel slide engagement. Together, they answer the two questions that mattered most but were previously impossible to track: "Which post brought me followers?" and "Which part of my carousel actually worked?"
Can You Access Instagram Insights Without a Business Account?
No — learning how to use Instagram Insights requires a Professional account (Business or Creator). Personal and private accounts see basic post metrics like total likes and comments, but cannot access reach data, follower demographics, audience active times, or content performance trends.
According to Meta's 2025 transparency report, over 200 million Instagram accounts are registered as business profiles, and the number continues to grow as creators realize how much data they are missing on personal accounts.
Here is what each account type can actually see:
| Feature | Personal Account | Creator Account | Business Account |
|---|---|---|---|
| Likes & Comments | Yes | Yes | Yes |
| Reach & Impressions | No | Yes | Yes |
| Follower Demographics | No | Yes | Yes |
| Active Times | No | Yes | Yes |
| Story Insights | No | Yes | Yes |
| Reels Insights | No | Yes | Yes |
| Contact Buttons | No | Limited | Full |
| Ad Tools | No | Yes | Yes |
Switching to a Professional account is free and takes under a minute. Go to Settings → Account type and tools → Switch to Professional account and choose either Creator (best for influencers and public figures) or Business (best for brands and shops). Your followers, posts, and DMs stay exactly the same — nothing is lost.
Pro Tip: If you want to see how to see post insights on an Instagram personal account without switching permanently, you can test a Creator account for a few weeks. Instagram lets you switch back to personal at any time, though you will lose access to historical Insights data once you revert.
For private accounts specifically, the same restriction applies: how to see insights on an Instagram private account requires switching to Professional first. Private mode and Insights are mutually exclusive — Instagram does not provide analytics for private profiles because the platform cannot track external reach on non-public content.
How to Use Instagram Insights to Your Advantage?
Knowing how to use Instagram Insights to your advantage means turning raw numbers into a repeatable growth strategy. The difference between checking metrics and acting on them is where most creators stall — as one social media user put it, "Getting views from the wrong audience" is the real problem, not low view counts.
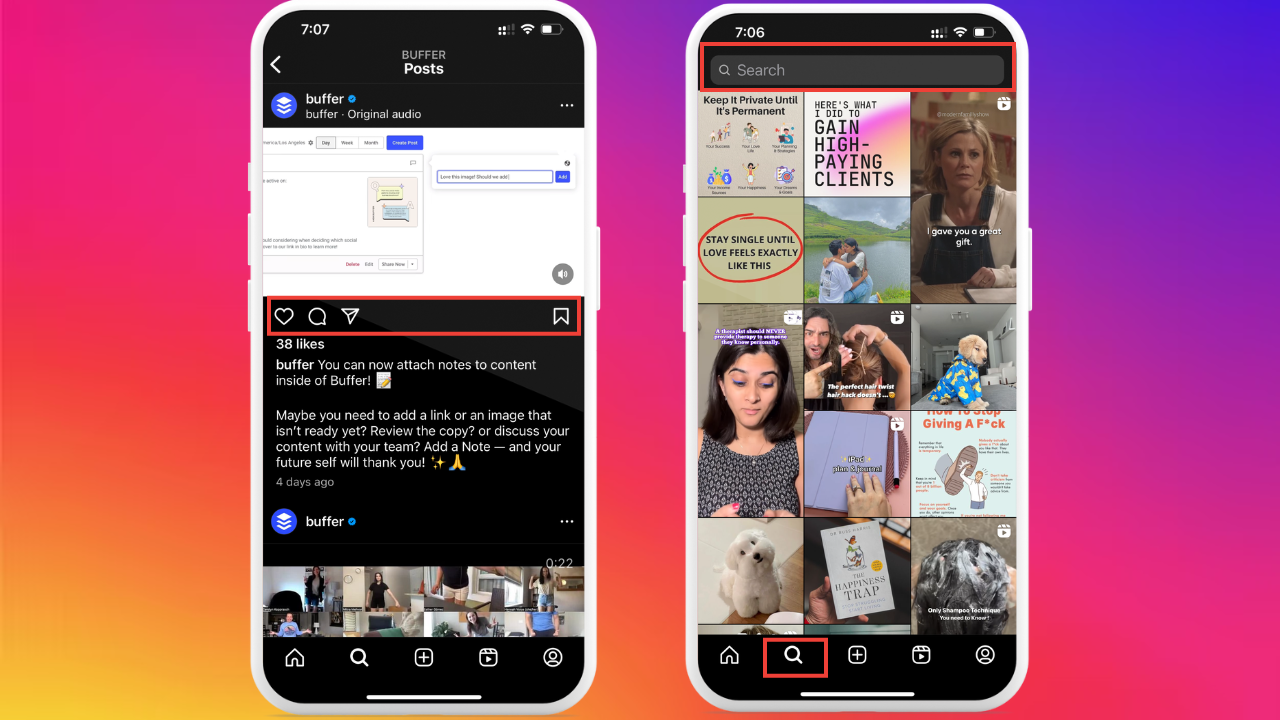
Find Your Best Time to Post with Instagram Insights
Open Followers → Most Active Times in your Insights dashboard to see when your specific audience is online. A 2025 study by Later using Instagram API data found that accounts posting during their audience's peak active hours see 23% higher reach on average. Check both the day-of-week and hour-of-day views, then schedule your top content for those windows. Revisit this data monthly — audience behavior shifts with seasons and trends.
Optimize Your Content Mix
Sort your posts by reach, then by engagement rate. Look for patterns: do carousels outperform single images? Do Reels with text overlays get more saves than talking-head videos? Use the new 2026 carousel slide-level engagement data to identify which slide formats hold attention longest. Double down on formats that drive both reach and meaningful engagement (saves, shares, sends) rather than formats that only generate passive likes.
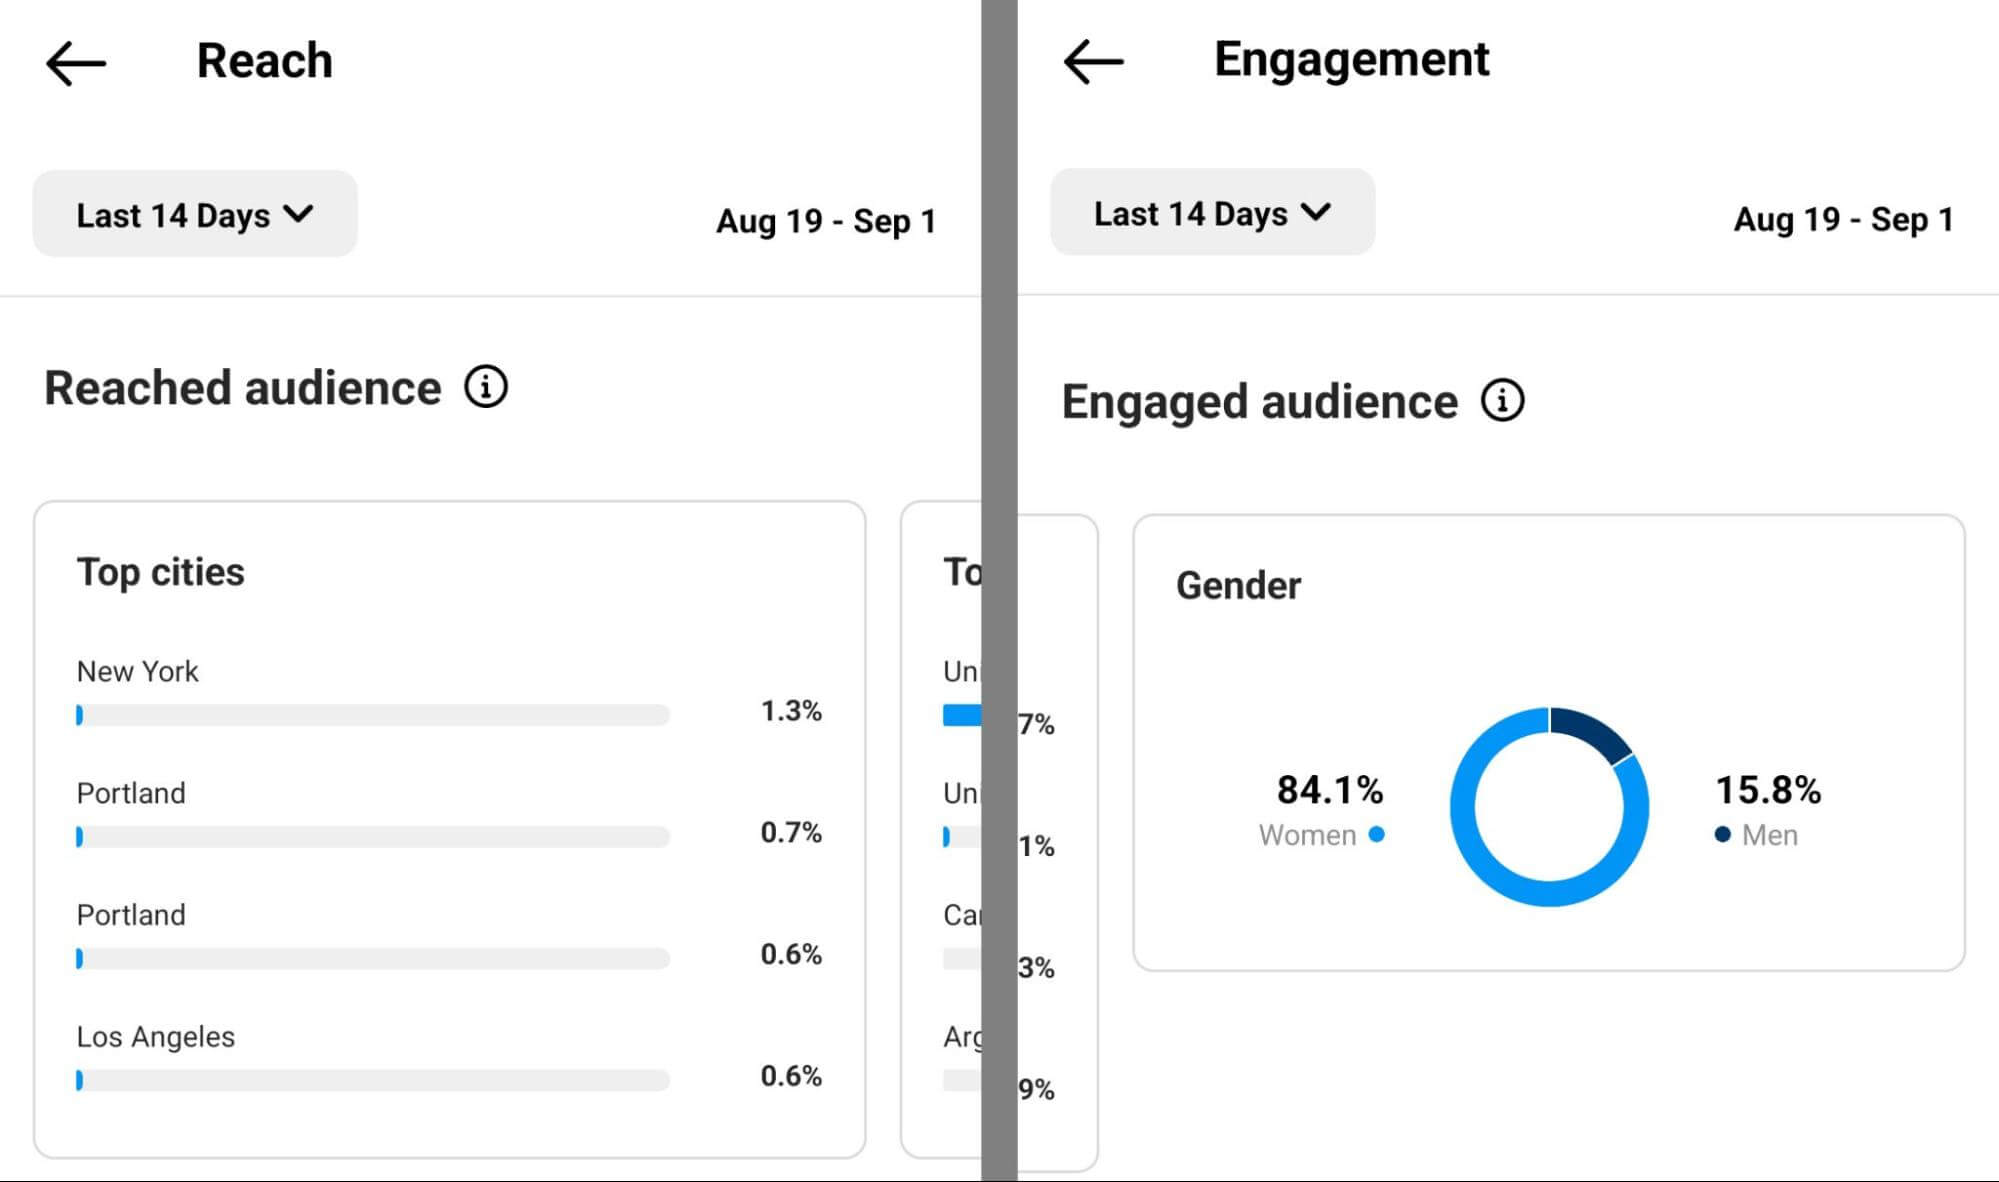
Analyze Instagram Audience Demographics
Navigate to Followers → Demographics to see age ranges, gender split, and top cities/countries. If your content targets U.S. women aged 25-34 but your largest follower segment is men aged 18-24, your messaging or hashtag strategy needs adjustment. We've found that creators who review their Insights weekly and adjust their content mix based on reach-to-follower ratio typically see 15-20% higher engagement within 60 days.
Understand Reach vs. Impressions
Reach counts unique accounts that saw your content. Impressions count total views, including repeat views from the same account. A post with 1,000 reach and 3,000 impressions means people came back to view it multiple times — a strong signal that the content resonated. When your impressions-to-reach ratio stays below 1.2, your content is seen once and forgotten. Aim for a ratio above 1.5 on your top-performing posts.
Weekly Insights Review Checklist
- Check top 3 posts by reach — identify common themes
- Review follower growth trend (up, flat, or declining)
- Compare Reels vs. carousel vs. single-image performance
- Note best-performing posting times and adjust schedule
- Review audience demographics for unexpected shifts
- Track saves-to-reach ratio as a content quality signal
This data-driven review takes 15 minutes per week and compounds over time. Accounts that treat Instagram analytics as a weekly habit rather than a monthly afterthought build momentum faster because they catch trends early and cut underperforming formats before wasting weeks on them.
Should You Use Instagram Insights or Third-Party Analytics Tools?
Native Instagram Insights covers the fundamentals — reach, engagement rate, follower demographics, and content performance — at zero cost. For most creators and small businesses, it provides enough data to make informed posting decisions without leaving the app.
The gap appears when you need historical depth or cross-platform reporting. Meta Business Suite extends the mobile experience to desktop and unlocks up to 90 days of historical data, compared to the 30-day window on the Instagram mobile app. Business Suite also lets you schedule posts, compare time periods side-by-side, and export reports — features the mobile instagram insights app lacks entirely.
Third-party tools like Iconosquare, Metricool, and Socialinsider go further. They offer competitor benchmarking, automated PDF reports, hashtag tracking, and multi-account dashboards. If you manage more than three accounts or need to present analytics to clients, a dedicated instagram insights checker with API-level access saves significant time.
| Feature | Native Insights | Meta Business Suite | Third-Party Tools |
|---|---|---|---|
| Cost | Free | Free | $29–$199/mo |
| History | 30 days | 90 days | 12+ months |
| Competitor data | None | None | Yes |
| Scheduled reports | No | Basic | Advanced |
| Best for | Solo creators | Small businesses | Agencies & brands |
As one social media manager put it: "Dashboards tell you what happened. AI agents tell you what to do next." That shift is already underway — several third-party platforms now include AI-powered content suggestions alongside traditional instagram analytics.
When to upgrade: If you find yourself screenshotting Insights data into spreadsheets more than twice a month, a third-party tool will likely pay for itself in time saved.